
Comparison of Multi-Resolution Spectrum Technology and Regular FFT in Modal Analysis
Introduction
Modal testing and analysis are crucial processes in the product development cycle. Sometimes the testing results are wrong by several magnitudes, especially in the low frequency bands where the frequency resolution is not sufficient. Crystal Instruments’ patented Multi-Resolution (MR) Spectrum technology helps overcome this issue with a unique solution. A modal test is carried out to examine data obtained through regular FFT technology and MR technology to quantify the modal results, such as damping, FRF amplitude, Auto-MAC chart, and mode shapes.
Test
Modal analysis is a vital process in optimizing the mechanical properties of the test unit. Studying the natural frequencies, damping and mode shapes of a structure helps users refine designs and improve the structural properties of the unit under test. To accurately obtain the modal parameters, it is important to configure the test settings appropriately and to distinctly identify the modes.
Many problems in mechanical structure and acoustic applications ask for a spectrum analysis method that generates frequency values with a non-uniform frequency resolution. In these applications, it is preferable for the lower frequency band to have a finer frequency resolution than the higher frequency band. For example, some mechanical structures might have closely spaced modes in the lower frequency range which might require fine frequency resolution measurements to aid in the enhanced modal analysis of the test structure. However, the testing and computation times for such high-resolution measurements might be long.
Crystal Instruments’ patented Multi-Resolution Spectrum technology provides a unique solution. The method of multi-resolution spectrum is a modification to the single pass FFT. The basic concept is that it applies two or more passes of FFT to the same incoming time streams and creates a synthesized spectrum in the frequency domain, where the frequency resolution varies. The Multi-Resolution (MR) Spectrum technology provides eight times higher spectral resolution in the low frequency region compared to the high frequency region without having to use enormous block sizes or enormous computational resources.
A modal test is carried out to compare the effect of multi-resolution and single resolution spectrum (regular FFT). In this case, the modal characteristics of a license plate is acquired by performing a MIMO FRF test carried out using a pair of modal shakers and 14 accelerometers. The shakers impart energy to the structure for a longer period which ensures more data sets. The higher quality of the measurements also helps improve the estimation of modal parameters.
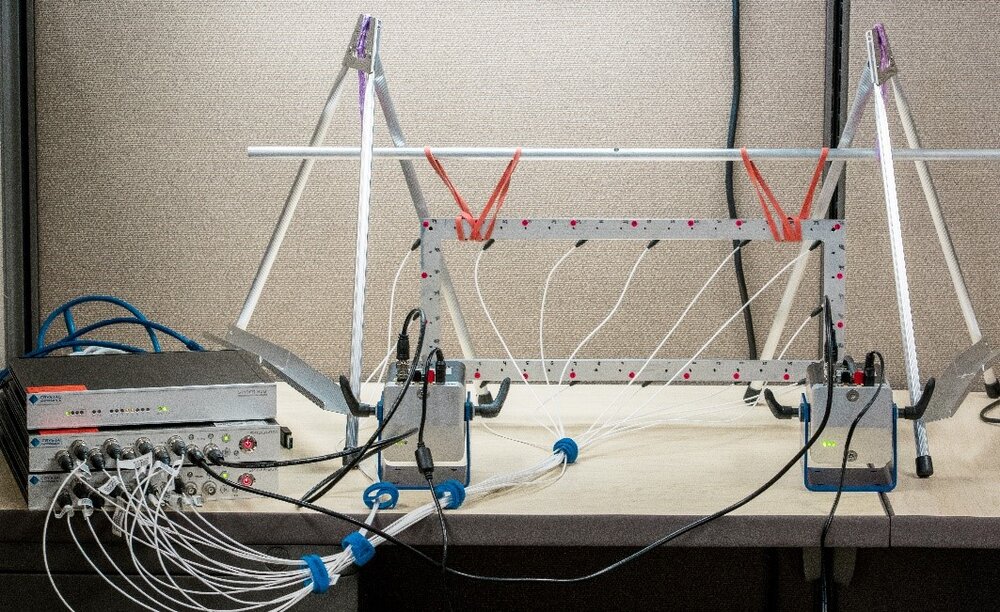
To run the high-channel count test (14 response channels and 2 excitation channels), a pair of Crystal Instruments Spider-80X front-endsare used with a Spider-Hub. The latest 9.0 release of the EDM Modal software aids in executing the MIMO FRF test.
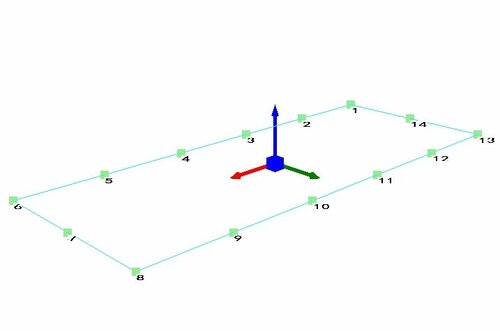
The structure is hung vertically using soft flexible cords to produce a free-free boundary condition. A white noise excitation from modal shakers is used to excite the steel plate. The response of the plate is captured using uni-axial accelerometers. A roving response method is usually implemented with a modal shaker test, but this procedure induces a mass loading effect in the results. To avoid this, small uni-axial accelerometers are attached on all the measurement points to capture the response of the entire plate in one shot. Measuring the excitation and response in the z-direction facilitates in obtaining the out-of-plane mode shapes. A mesh configuration model of the test structure is shown below.
The lower order modes are of interest in this modal test and hence a sampling rate of 5.1 kHz is used. A block size of 2048 is used, and a Hann window is implemented to reduce leakage. These configuration settings produce a frequency resolution of 2.5 Hz. Linearly averaging 16 blocks of data at each DOF helps in producing measurements of higher accuracy and reduced noise.
An eight times finer resolution of 0.3125 Hz is obtained in the low-frequency range using multi-resolution spectrum analysis. This is achieved by using a relatively larger block size which is not needed in the high frequency region because of the dynamics of the test structure. This implementation of different resolutions produces better results without any increase in the loop time. The cutoff frequency dividing the low and high-frequency range is 250 Hz. In this low-frequency region, the results from the multi-resolution tests are better because of the finer frequency resolution. After this cut-off frequency, the multi-resolution and single-resolution spectrum would yield comparable results since they have the same frequency resolution. All other settings, configurations and setup are the same for both multi-resolution and single-resolution tests.
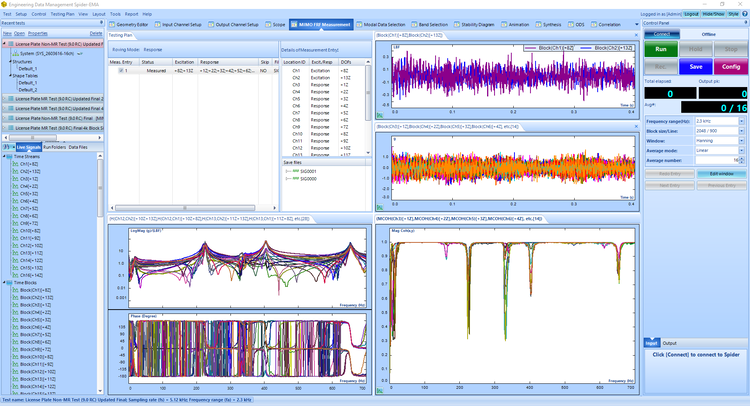
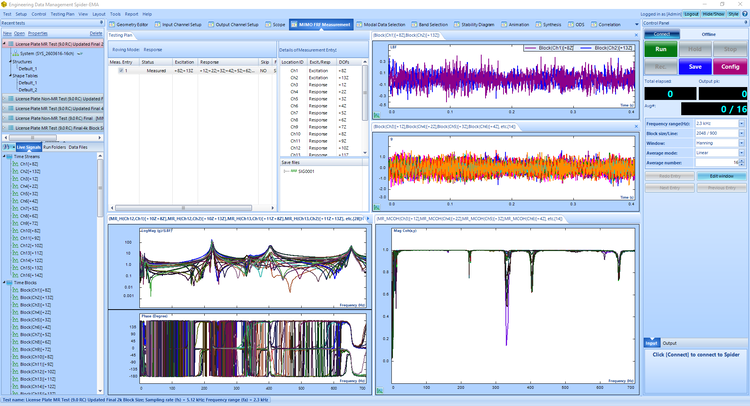
The measurement tab screenshots show users that the block size is the same for both the MR and non-MR modal tests. The figures above show that both tests have the same block size of 0.4 seconds for the MIMO FRF measurements. The configuration settings shown on the control panel are the same for the tests as well. Both tests have a good multiple coherence measurement of close to 1 with some valleys which only occur at the anti-resonances. This validates that the inputs and outputs are well correlated. This also helps attain confidence that the measurements are repeatable.
The FRF measurement shows four peaks in the 0 -700 Hz frequency band with two closely spaced modes near the 220 Hz region. Plotting the imaginary part of all the FRFs guides allows users to observe the phase relationship between the measurement DOFs. The good alignment of the peaks on the imaginary portion of the FRFs indicates that there is no mass loading effect induced in the results.
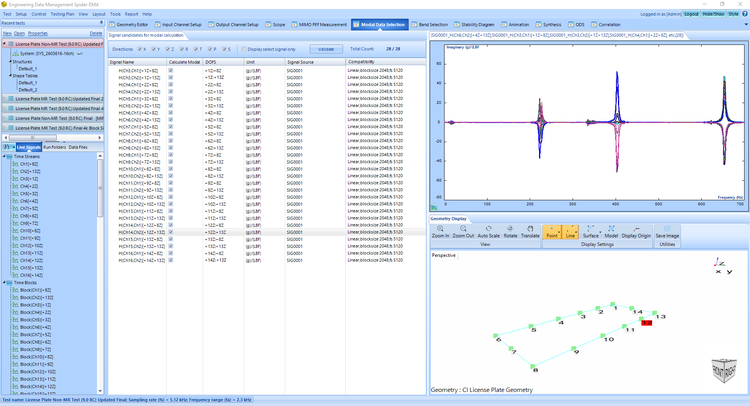
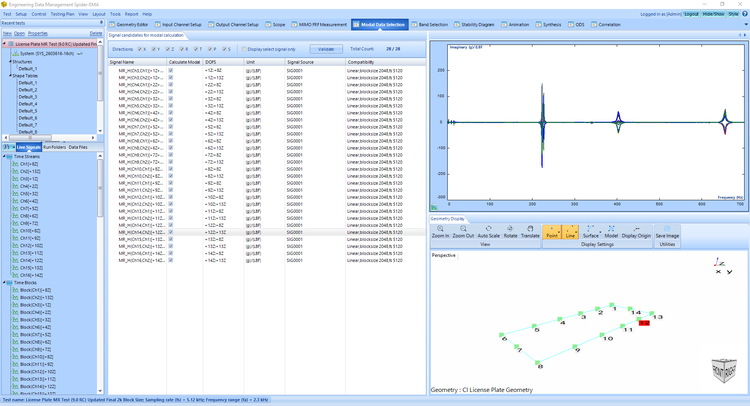
The figures above show that all peaks are identified with both MR and non-MR modal tests. However, because of the finer resolution in the 0 -250 Hz frequency band with MR technology, the closed spaced modes have much sharper and cleaner peaks which also makes them well separated as indicated from the figures and the Y-axis amplitude.
Modal Analysis
The new Poly-X (https://www.crystalinstruments.com/modal-analysis) method is used to curve-fit all the FRF’s using a 30-order polynomial to procure the following stability diagram. Since two shakers were used for excitation (two references), two Complex Mode Indicator Function’s (CMIF) are present in the stability diagram. Four modes are selected within the desired frequency range.
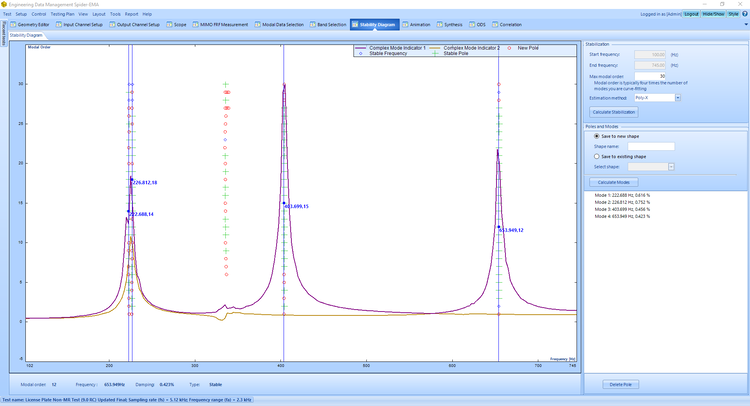
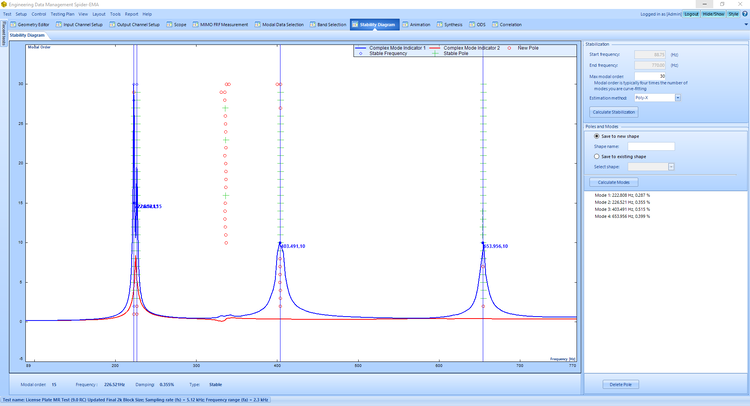
The stability diagram indicates that both the non-MR and MR modal test efficiently identifies four modes in the desirable frequency range. However, as users can observe, the peaks are much sharper which leads to a better estimation of the damping and mode shapes as discussed below.
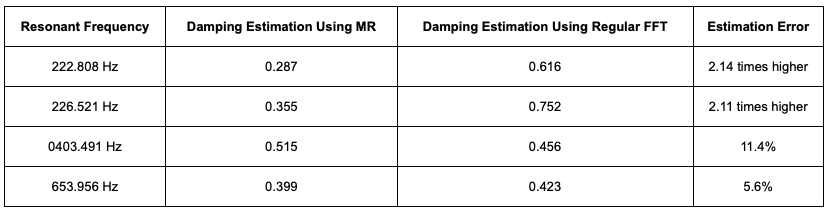
The damping for the first two modes is much better identified with the MR modal test when compared to the non-MR modal test. After the cutoff frequency range of 250 Hz, the results obtained with MR and non-MR are similar because of the same test settings.
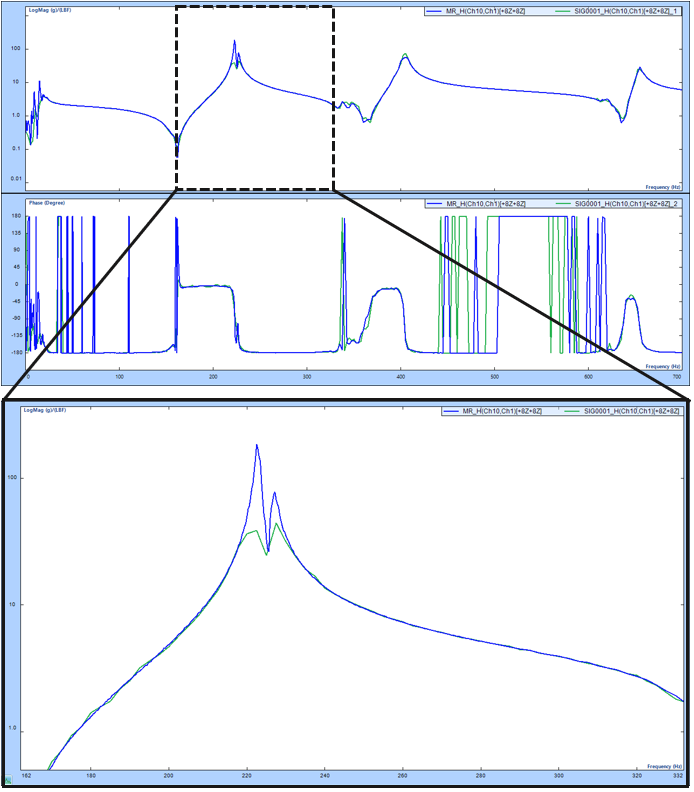
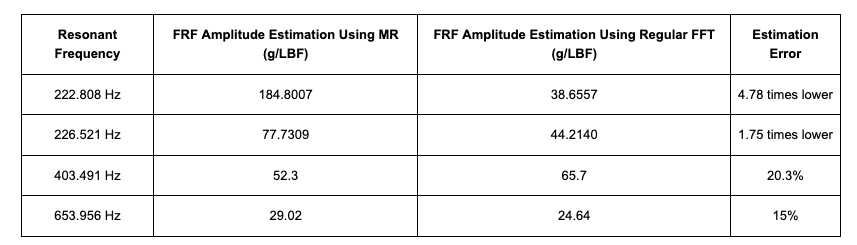
The better resolution with MR leads to much sharper peaks being measured, which greatly improves the estimation of the FRF amplitudes as shown below (a sample FRF of the same DOF is chosen for comparison). After the cutoff frequency range of 250 Hz, the results are similar between the MR and non-MR test because they have the same frequency resolution.
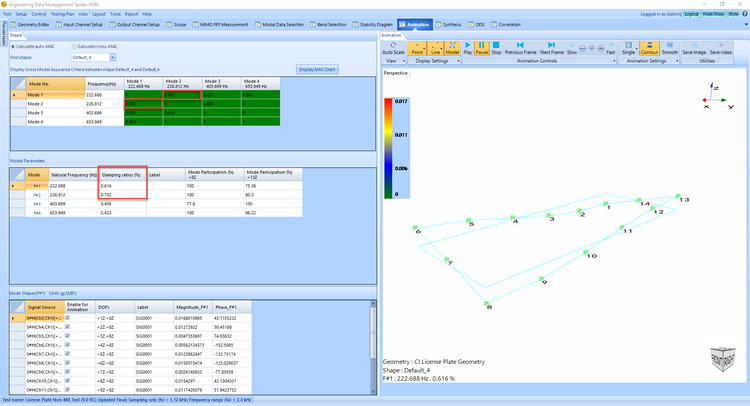
The Auto-MAC matrix helps users validate the results of modal measurements. The Auto-MAC matrix below shows that the modes are orthogonal to each other (low off-diagonal elements) and are uniquely identified (high diagonal elements).
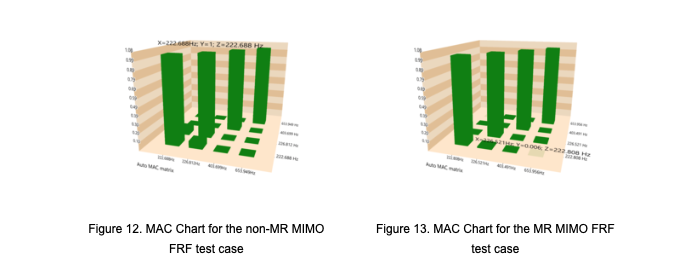
The MAC charts show that both non-MR and MR modal test measurements are good but the correlation between Mode 1 and 2 is slightly higher for the non-MR test case. However, for the MR test case, they are much more distinctly identified and as a result have negligible cross elements.
The mode shapes obtained are relatively better with the MR technology because of higher FRF amplitude and phase accuracy. The mode shapes on the left are those obtained through the non-MR tests and the ones on the right are those obtained with the MR technology enabled in the modal test within the low frequency range of 0 – 250 Hz.
The results emphasize the unique advantages of Multi-Resolution spectrum technology in Modal Analysis. To learn more about Multi-Resolution Spectrum Analysis, visit: https://www.crystalinstruments.com/multi-resolution-spectrum-analysis